First US wild bee map reveals 139 ‘trouble zone’ counties
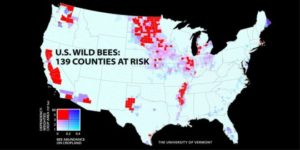
 A new study of wild bees identifies 139 counties in key agricultural regions of California, the Pacific Northwest, the Midwest, west Texas and the Mississippi River valley that face a worrisome mismatch between falling wild bee supply and rising crop pollination demand.
Credit: PNAS
The first-ever study to map U.S. wild bees suggests they are disappearing in the country’s most important farmlands — from California’s Central Valley to the Midwest’s corn belt and the Mississippi River valley.
If wild bee declines continue, it could hurt U.S. crop production and farmers’ costs, said Taylor Ricketts, a conservation ecologist at the University of Vermont, at the American Association for the Advancement of Science (AAAS) annual meeting panel, Plan Bee: Pollinators, Food Production and U.S. Policy on Feb. 19.
“This study provides the first national picture of wild bees and their impacts on pollination,” said Ricketts, Director of UVM’s Gund Institute for Ecological Economics, noting that each year $3 billion of the U.S. economy depends on pollination from native pollinators like wild bees.
At AAAS, Ricketts briefed scholars, policy makers, and journalists on how the national bee map, first published in the Proceedings of the National Academy of Sciences in late 2015, can help to protect wild bees and pinpoint habitat restoration efforts.
At the event, Ricketts also introduced a new mobile app that he is co-developing to help farmers upgrade their farms to better support wild bees.
“Wild bees are a precious natural resource we should celebrate and protect,” said Ricketts, Gund Professor in UVM’s Rubenstein School of Environment and Natural Resources. “If managed with care, they can help us continue to produce billions of dollars in agricultural income and a wonderful diversity of nutritious food.”
TROUBLE ZONES
The map identifies 139 counties in key agricultural regions of California, the Pacific Northwest, the upper Midwest and Great Plains, west Texas, and Mississippi River valley, which appear to have most worrisome mismatch between falling wild bee supply and rising crop pollination demand.
These counties tend to be places that grow specialty crops — like almonds, blueberries and apples — that are highly dependent on pollinators. Or they are counties that grow less dependent crops — like soybeans, canola and cotton — in very large quantities.
Of particular concern, some crops most dependent on pollinators — including pumpkins, watermelons, pears, peaches, plums, apples and blueberries — appeared to have the strongest pollination mismatch, growing in areas with dropping wild bee supply and increasing in pollination demand.
Globally, more than two-thirds of the most important crops either benefit from or require pollinators, including coffee, cacao, and many fruits and vegetables.
Pesticides, climate change and diseases threaten wild bees — but their decline may be caused by the conversion of bee habitat into cropland, the study suggests. In 11 key states where the map shows bees in decline, the amount of land tilled to grow corn spiked by 200 percent in five years — replacing grasslands and pastures that once supported bee populations.
RISING DEMAND, FALLING SUPPLY
Over the last decade, honeybee keepers facing colony losses have struggled with rising demand for commercial pollination services, pushing up the cost of managed pollinators — and the importance of wild bees.
“Most people can think of one or two types of bee, but there are 4,000 species in the U.S. alone,” said Insu Koh, a UVM postdoctoral researcher who co-hosted the AAAS panel and led the study.
“When sufficient habitat exists, wild bees are already contributing the majority of pollination for some crops,” Koh adds. “And even around managed pollinators, wild bees complement pollination in ways that can increase crop yields.”
MAKING THE MAPS
A team of seven researchers — from UVM, Franklin and Marshall College, University of California at Davis, and Michigan State University — created the maps by first identifying 45 land-use types from two federal land databases, including croplands and natural habitats. Then they gathered detailed input from national and state bee experts about the suitability of each land-use type for providing wild bees with nesting and food resources.
The scientists built a bee habitat model that predicts the relative abundance of wild bees for every area of the contiguous United States, based on their quality for nesting and feeding from flowers. Finally, the team checked and validated their model against bee collections and field observations in many actual landscapes.
Story Source:
Materials provided by University of Vermont. Note: Content may be edited for style and length.


